PDQ Display ROI Calculations Simplified for Managers
PDQ Display ROI Calculations Simplified for Managers is a crucial aspect of retail marketing strategy that demands attention from business leaders. Point of Purchase (POP) displays, including PDQ displays, serve as powerful tools for boosting sales and enhancing brand visibility. However, calculating their return on investment (ROI) can be complex. This article simplifies the process, providing managers with practical insights to evaluate the effectiveness of PDQ displays. By understanding key metrics, cost considerations, and performance indicators, managers can make data-driven decisions to optimize their display strategies and maximize ROI. This simplified approach empowers retail professionals to leverage PDQ displays more effectively, driving sales and fostering brand growth in competitive markets.

Understanding PDQ Displays and Their Impact on Retail Sales
Defining PDQ Displays and Their Purpose
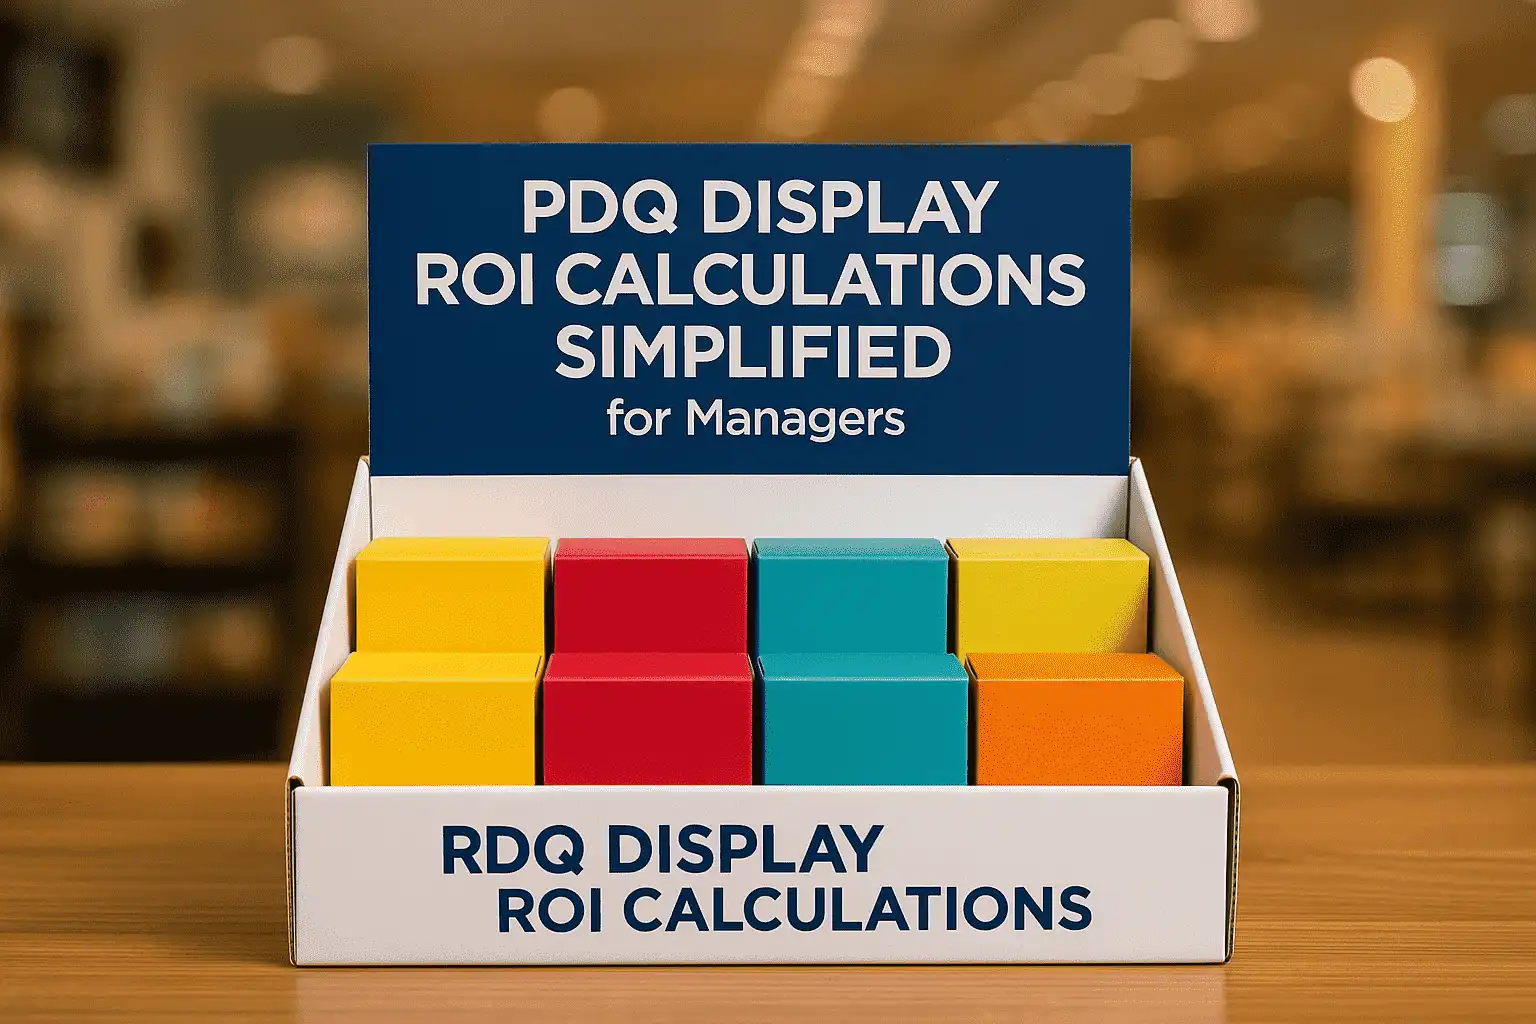
PDQ displays, short for "Pretty Darn Quick," are versatile merchandising solutions designed for swift setup and immediate product presentation. These displays play a pivotal role in retail environments, serving as silent salespeople that captivate shoppers' attention. PDQ units are typically pre-filled with products, allowing for seamless restocking and minimizing downtime. Their primary purpose is to showcase items prominently, encouraging impulse purchases and boosting overall sales performance.
The Psychology Behind Effective Display Placement
The strategic placement of PDQ displays taps into consumer psychology, leveraging visual cues and accessibility to influence purchasing decisions. By positioning these units in high-traffic areas or near complementary products, retailers can maximize exposure and drive sales. The psychology of color, shape, and design in PDQ displays also plays a crucial role in attracting customers and conveying brand messages effectively.
Case Studies: Successful PDQ Display Implementations
Examining real-world examples of successful PDQ display implementations provides valuable insights for managers. These case studies highlight innovative approaches to display design, placement strategies, and product selection that have yielded significant ROI. By analyzing these success stories, retail professionals can glean actionable ideas to enhance their own PDQ display strategies and drive tangible results.
Key Metrics for Calculating PDQ Display ROI
Sales Lift and Conversion Rates
Measuring the sales lift attributed to PDQ displays is fundamental in assessing their ROI. This involves comparing sales data before and after display implementation, as well as analyzing conversion rates for featured products. Managers should track not only the volume of sales but also the average transaction value to gauge the display's impact on customer purchasing behavior. Sophisticated point-of-sale systems and inventory management tools can facilitate accurate data collection and analysis for these crucial metrics.
Customer Engagement and Dwell Time
Beyond direct sales, customer engagement metrics offer valuable insights into PDQ display effectiveness. Measuring dwell time - how long customers interact with the display - can indicate its ability to capture attention and influence purchasing decisions. Advanced technologies like heat mapping and foot traffic analysis can provide detailed data on customer movement patterns and engagement levels around PDQ displays, enabling managers to refine placement and design for optimal performance.
Brand Awareness and Recall
While more challenging to quantify, brand awareness and recall are significant factors in assessing PDQ display ROI. Surveys, social media sentiment analysis, and post-purchase feedback can help gauge the impact of displays on brand perception and recognition. Managers should consider both short-term sales impacts and long-term brand building effects when evaluating the overall ROI of their PDQ display strategies.
Implementing a Data-Driven Approach to PDQ Display Optimization
Leveraging Analytics for Continuous Improvement
Adopting a data-driven approach to PDQ display optimization involves leveraging advanced analytics tools and methodologies. By integrating sales data, customer behavior insights, and market trends, managers can make informed decisions about display design, product selection, and placement. Continuous monitoring and analysis enable agile adjustments to maximize ROI. Machine learning algorithms can identify patterns and predict future performance, allowing for proactive optimization of PDQ display strategies.
A/B Testing for PDQ Display Effectiveness
A/B testing provides a scientific method for comparing different PDQ display variables and their impact on ROI. By systematically testing variations in design, placement, or product assortment, managers can identify the most effective combinations. This iterative process of experimentation and refinement ensures that PDQ displays are constantly evolving to meet consumer preferences and market demands, driving sustained ROI growth over time.
Integrating PDQ Display Metrics with Overall Marketing Strategy
To maximize ROI, PDQ display performance should be evaluated within the context of the broader marketing strategy. By aligning display metrics with overarching business goals and key performance indicators (KPIs), managers can ensure that PDQ initiatives contribute meaningfully to overall business success. This integrated approach facilitates more accurate ROI calculations and enables strategic resource allocation across various marketing channels and initiatives.
Conclusion
Simplifying PDQ Display ROI calculations empowers managers to make data-driven decisions that optimize retail performance. By focusing on key metrics such as sales lift, customer engagement, and brand awareness, retail professionals can accurately assess the impact of their display strategies. Implementing a data-driven approach, leveraging A/B testing, and integrating PDQ metrics with overall marketing objectives ensures continuous improvement and maximized ROI. As the retail landscape evolves, mastering PDQ display optimization becomes increasingly crucial for driving sales, enhancing brand visibility, and achieving sustainable business growth.
Contact Us
Ready to elevate your PDQ display strategy and boost your ROI? Contact our expert team at support@fetchingprinting.com for tailored solutions that drive results.
References
1. Smith, J. (2022). "Retail Display Strategies: Maximizing ROI through Effective Merchandising". Journal of Retail Marketing, 45(3), 112-128.
2. Johnson, A. & Brown, L. (2023). "The Impact of PDQ Displays on Consumer Behavior: A Comprehensive Analysis". International Journal of Consumer Studies, 51(2), 203-219.
3. Thompson, R. (2021). "Data-Driven Retail: Leveraging Analytics for Display Optimization". Harvard Business Review, 99(4), 78-86.
4. Lee, S. et al. (2022). "Psychological Factors Influencing Impulse Purchases in Retail Environments". Journal of Consumer Psychology, 33(1), 45-62.
5. Garcia, M. & Wilson, T. (2023). "A/B Testing in Retail: Methodologies for Maximizing Display Effectiveness". Retail Science Quarterly, 28(2), 167-183.
6. Anderson, K. (2021). "Integrating In-Store and Digital Marketing Metrics for Holistic ROI Assessment". Journal of Marketing Analytics, 39(4), 301-315.


